HOME
10 THINGS TO DO BEFORE SELLING YOUR HOUSE
Before you put your house on the market, ask me for guidance on improving your home's presentation. I can tell you what buyers expect in your particular market and at your home's price point. Click here, the following 10 steps are a way to get a good head start on preparing to sell your home.
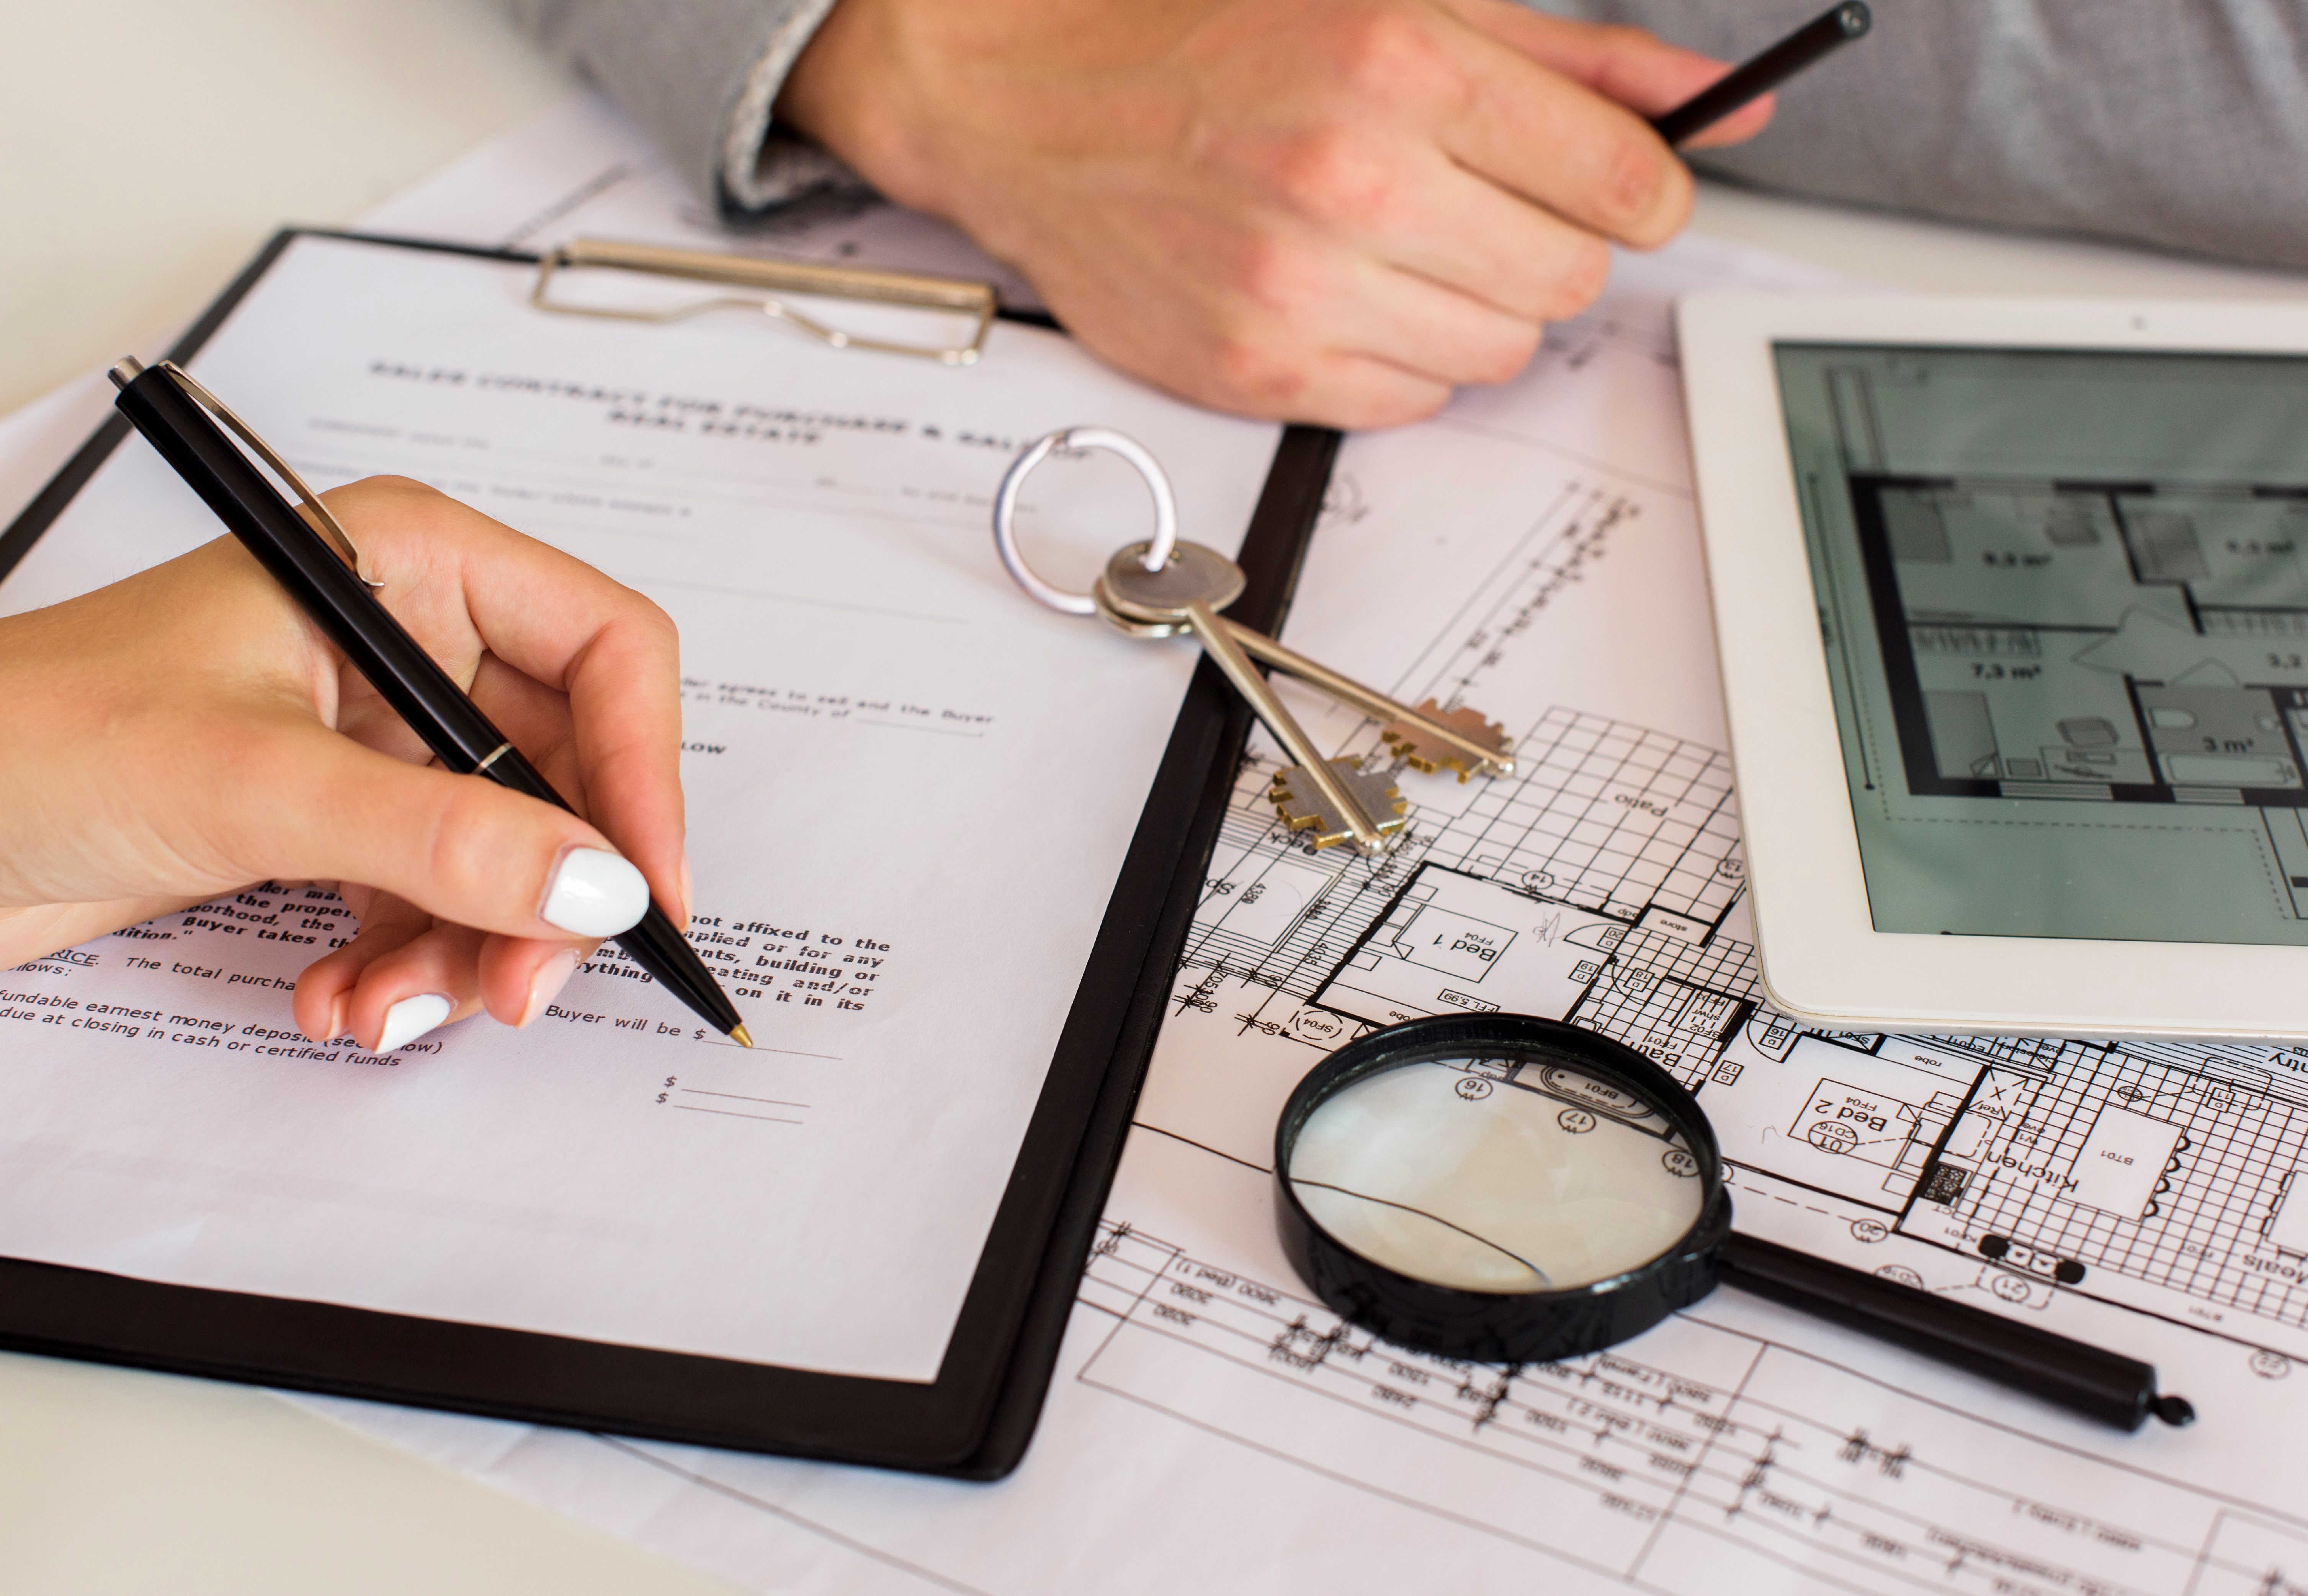
THE HOME-BUYING PROCESS IN 8 STEPS

The path toward homeownership can be a long and winding road. By thoroughly understanding each step of the process, homebuyers can avoid obstacles, eliminate uncertainty, and experience the excitement of finding a house to call home. You can break the home-buying process into eight essential steps, click here to read more.
5 DE-CLUTTERING TIPS FOR YOUR KITCHEN
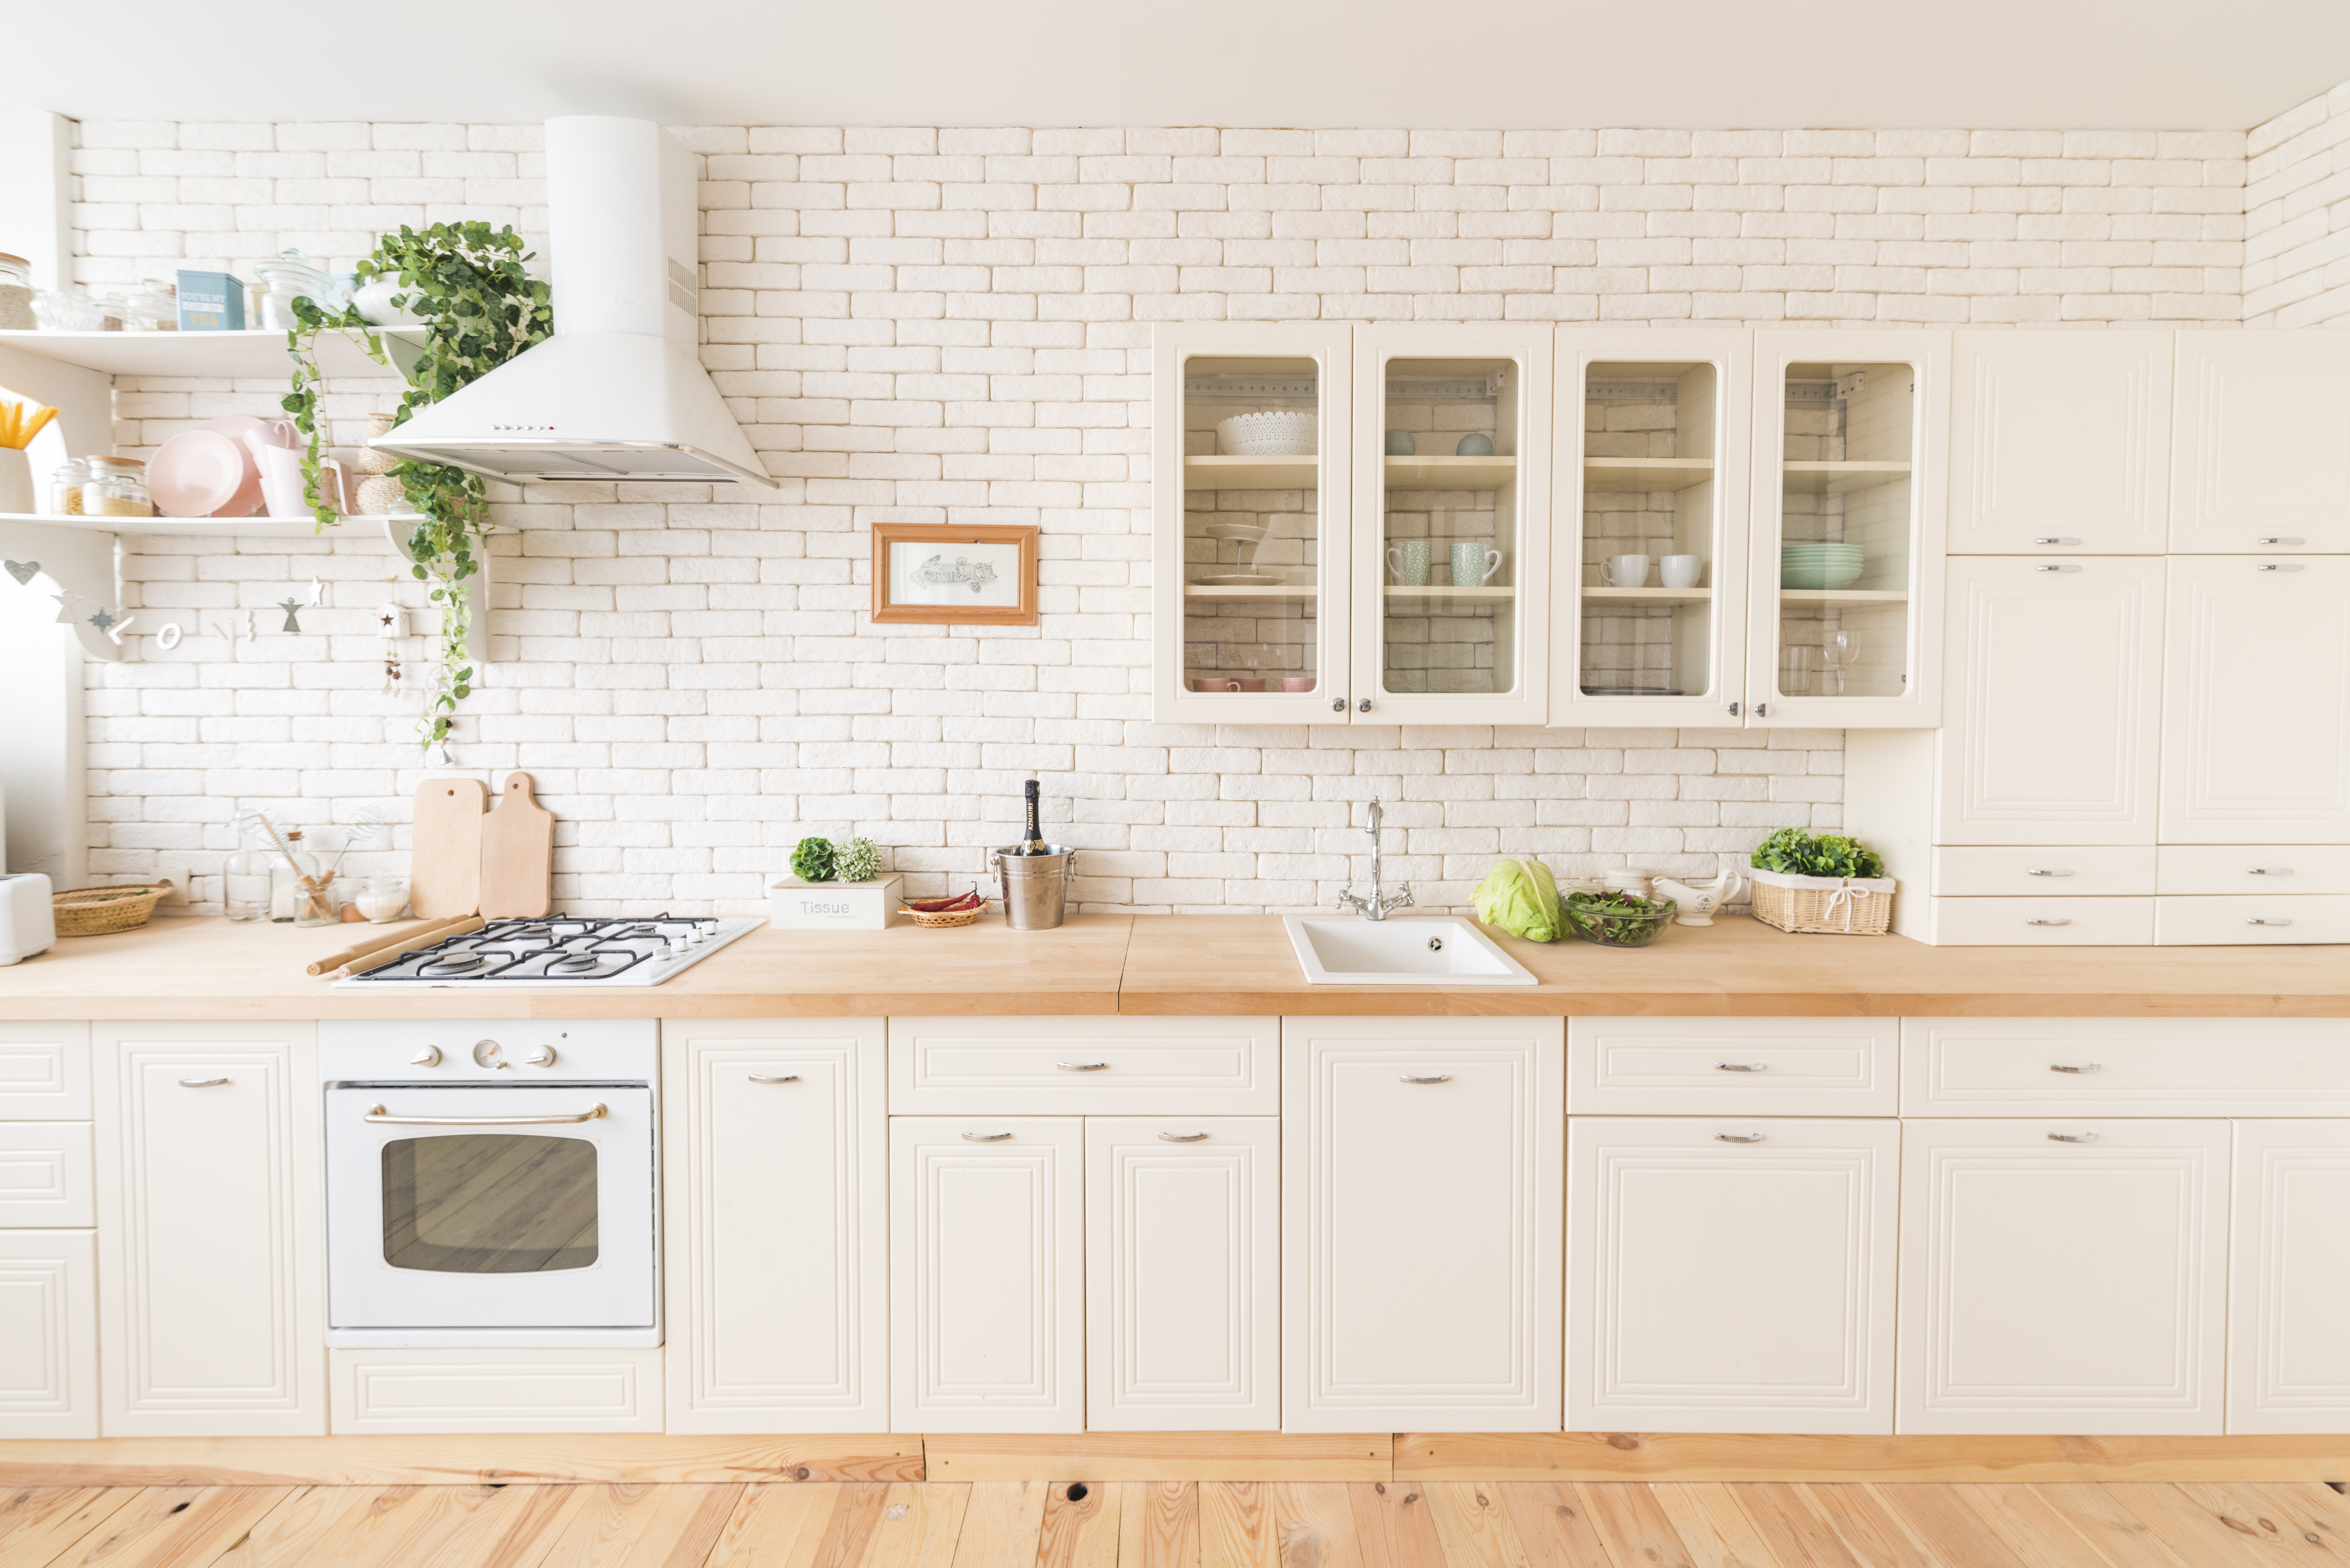
Is the chaos on your countertop out of control? Click here for a few tips to conquer the clutter.
READY TO BUY A HOME TOGETHER?
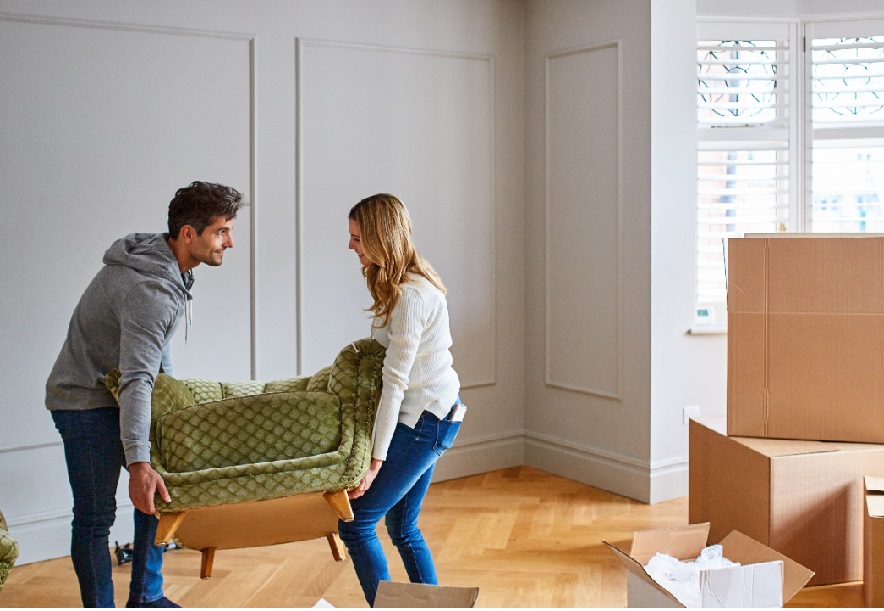
Whether they’re not quite ready to tie the knot or would rather spend money on a down payment than a wedding, many couples are choosing to purchase a home with their partner prior to taking a trip down the aisle. Click here to read more.